


If you’re dealing with numbers, graphs and charts happen to be the best way to make sense out of those numbers! Charts and graphs can help you understand your data and help you make decisions based on them. With Appsmith, you can connect your data sources in just a few steps and generate beautiful graphs and charts.
As of now, Appsmith supports the following databases (in addition to using any REST APIs):
- MySQL
- MS SQL
- Postgres
- Amazon S3
- Google Sheets
- Snowflake
- Redshift
- Redis
- Elastic Search
- Firestore
- ArangoDB
In this article, we will display data from our MySQL database to our app on Appsmith.
Step 1: Create app, and connect database
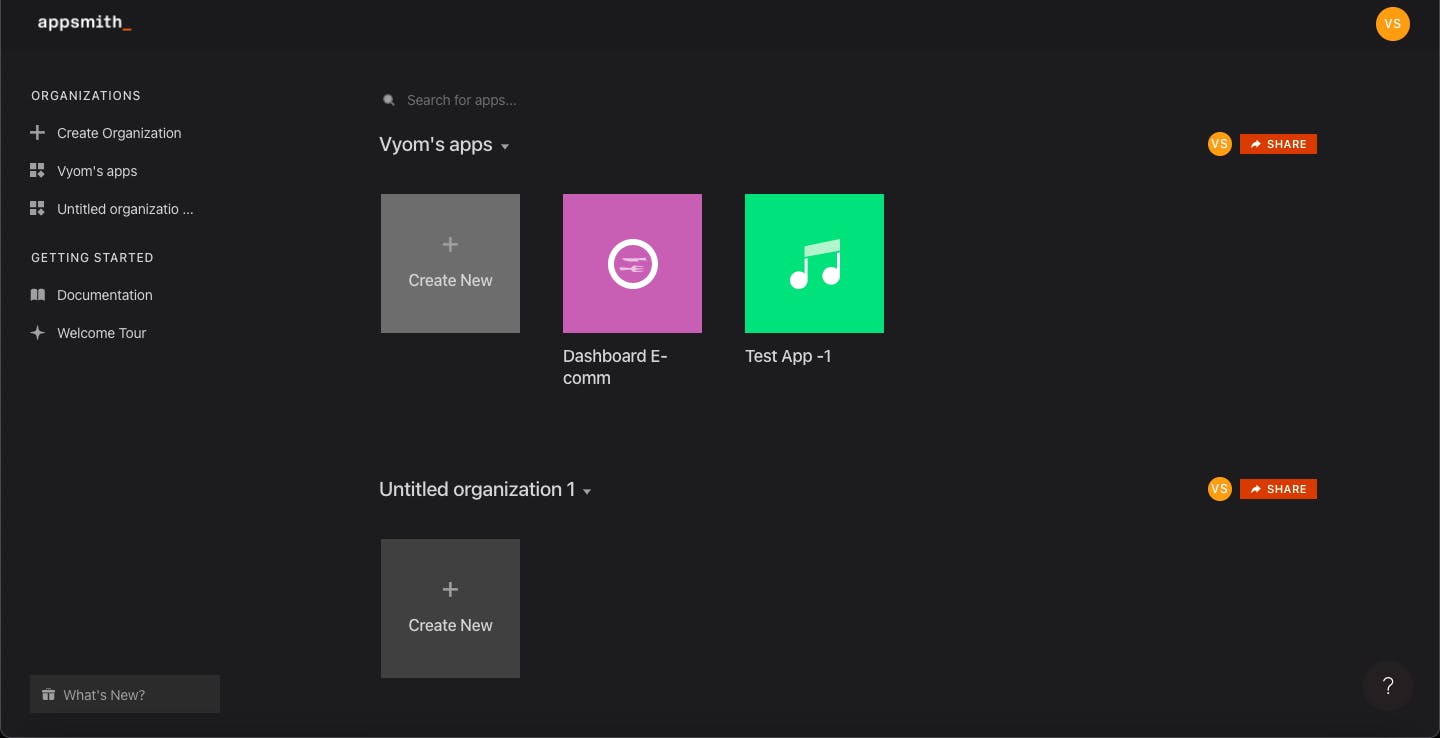
Login to your Appsmith account or create a new account (if you don’t have one). Once you're logged in, click on the “Create New” button:
After that, click on the Build with Drag & Drop widget. You’ll see this:
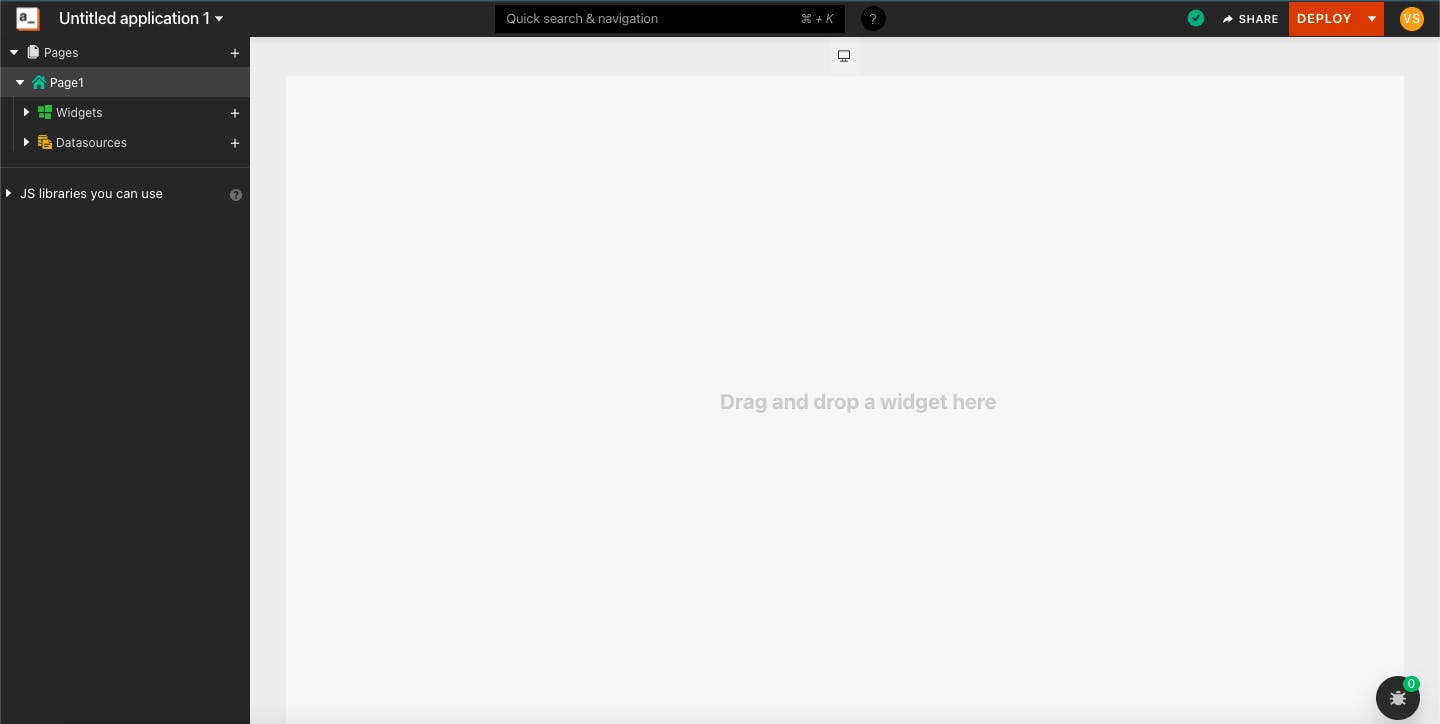
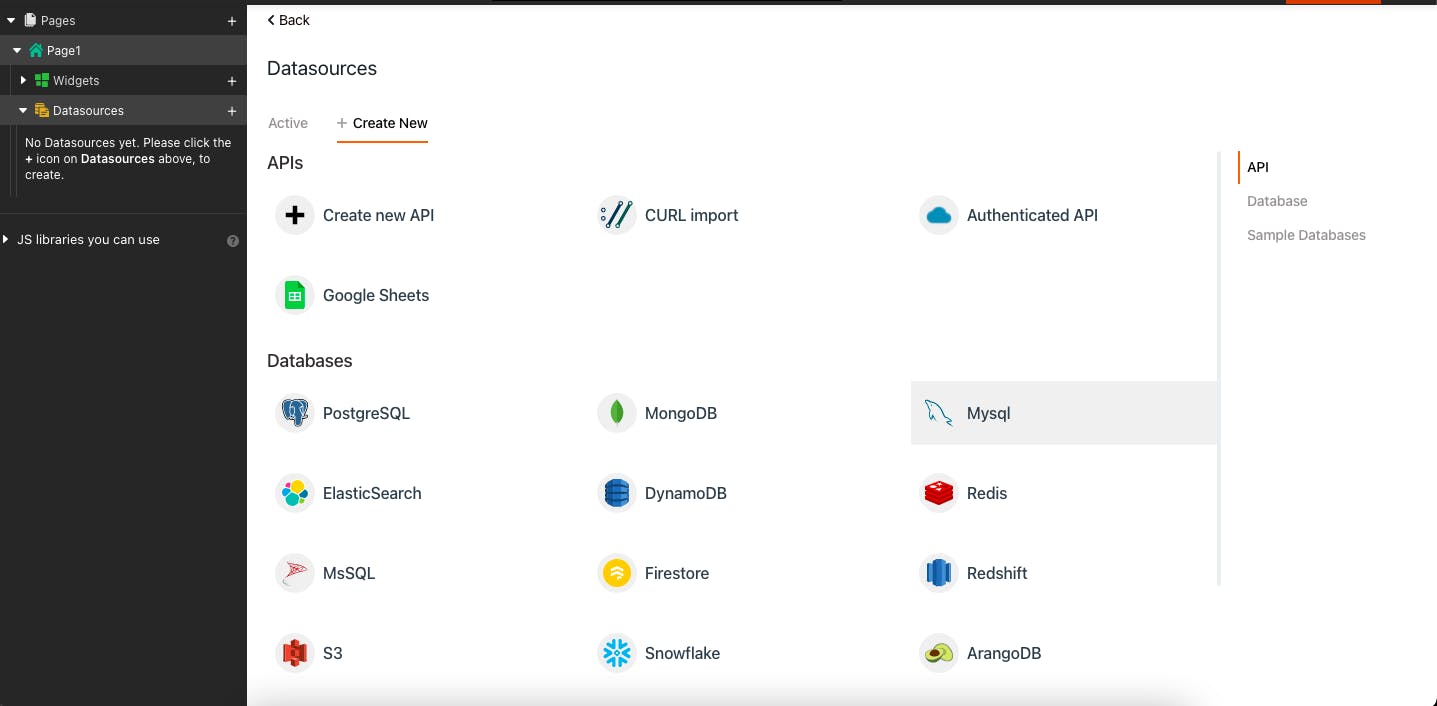
On the left sidebar, you can see an option for “Datasources”. Click on the “+” button and it will open a list of all supported data sources by Appsmith:
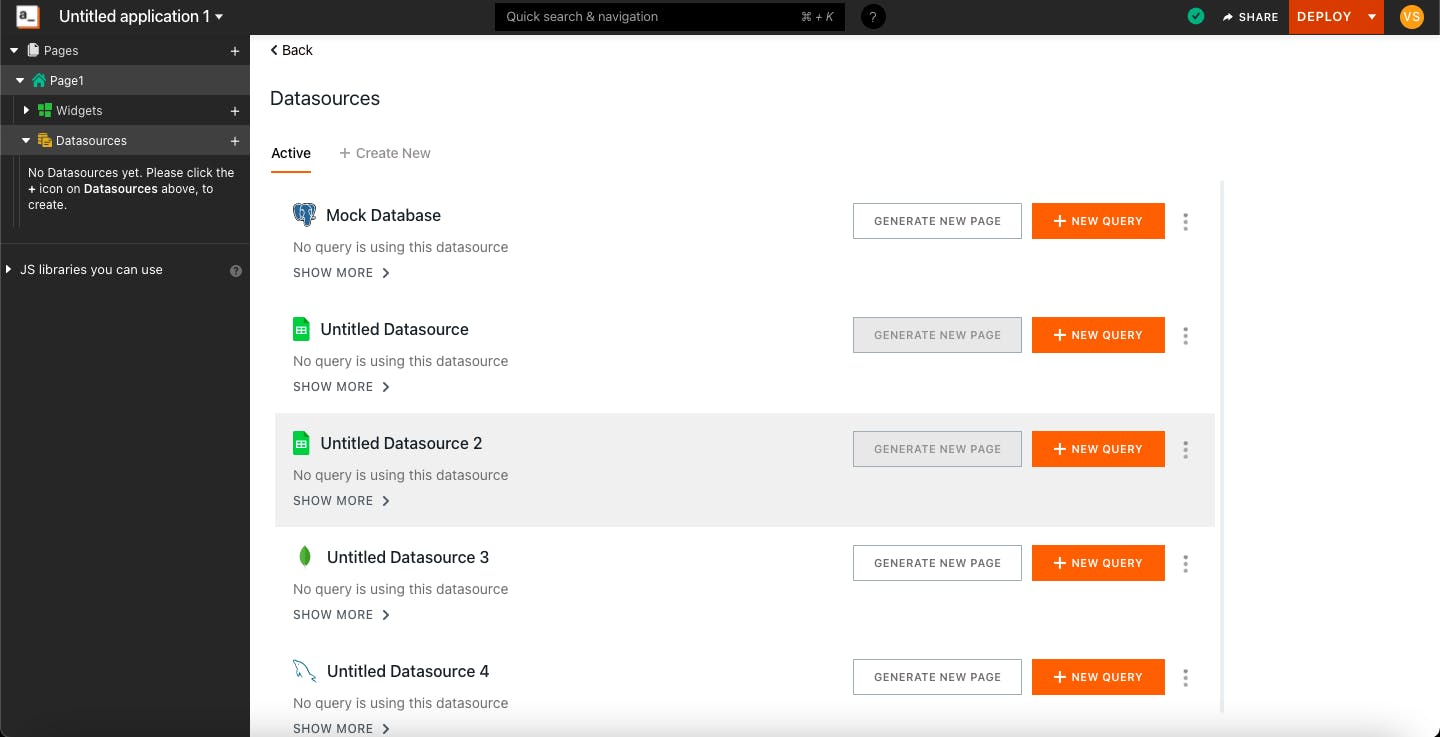
For this blog, I will use the Mock Database (provided to all users of Appsmith to help with quick prototyping), which is based on MySQL; you can go for your preferred database.
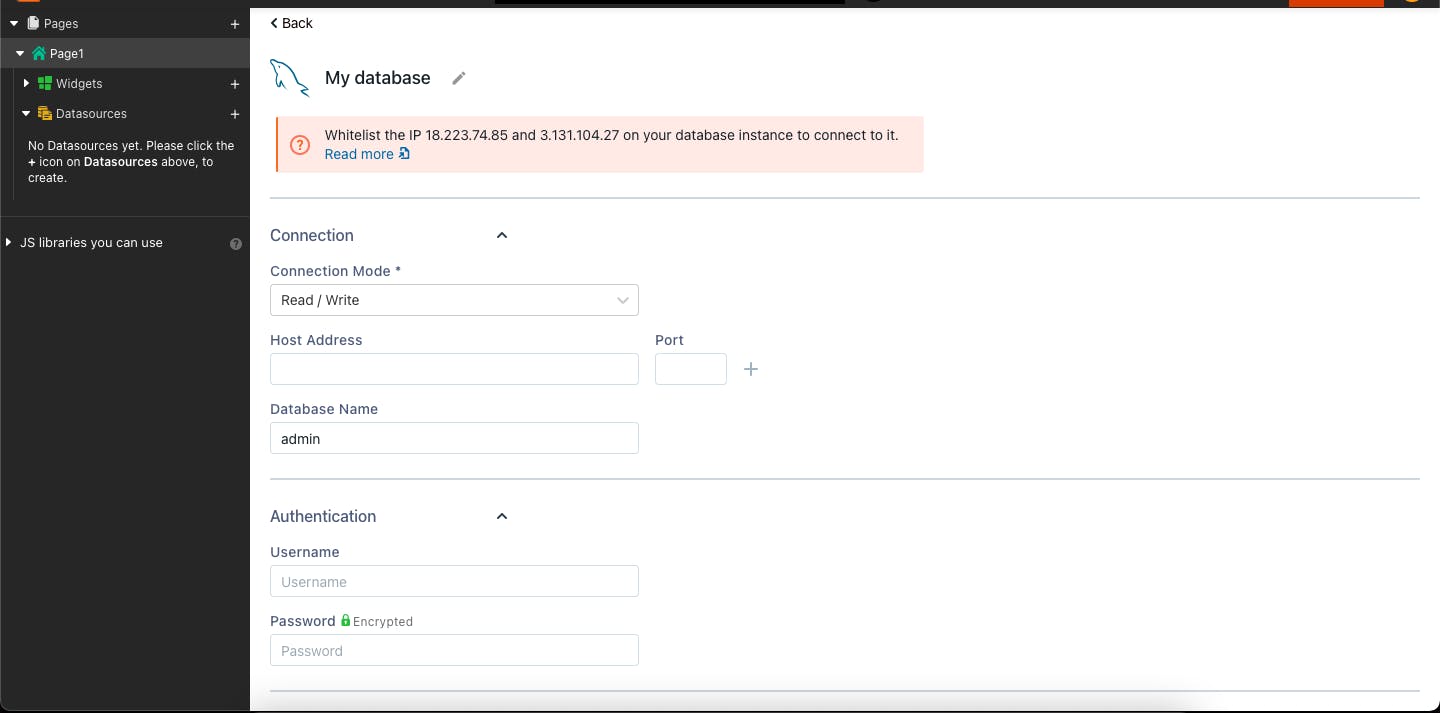
NOTE: Since I am using Mock Database, it’s not asking for database credentials. But, when you select another data source, you’ll need to enter the database credentials. Let’s say you want to connect to a new data source. You’ll see the below page:
Once you select the data source (for example, MySQL), you now need to enter your credentials:
Step -2: Add the first query and widget
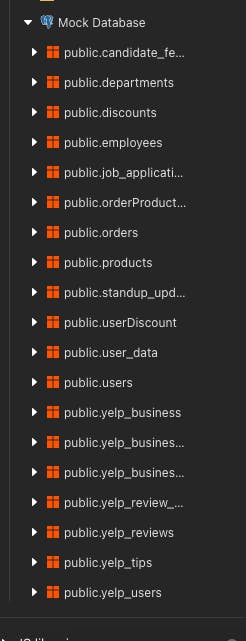
Once you have added the database (in this case, selected the data source), you should see the list of all the tables present in your database.
Here’s how it will look:
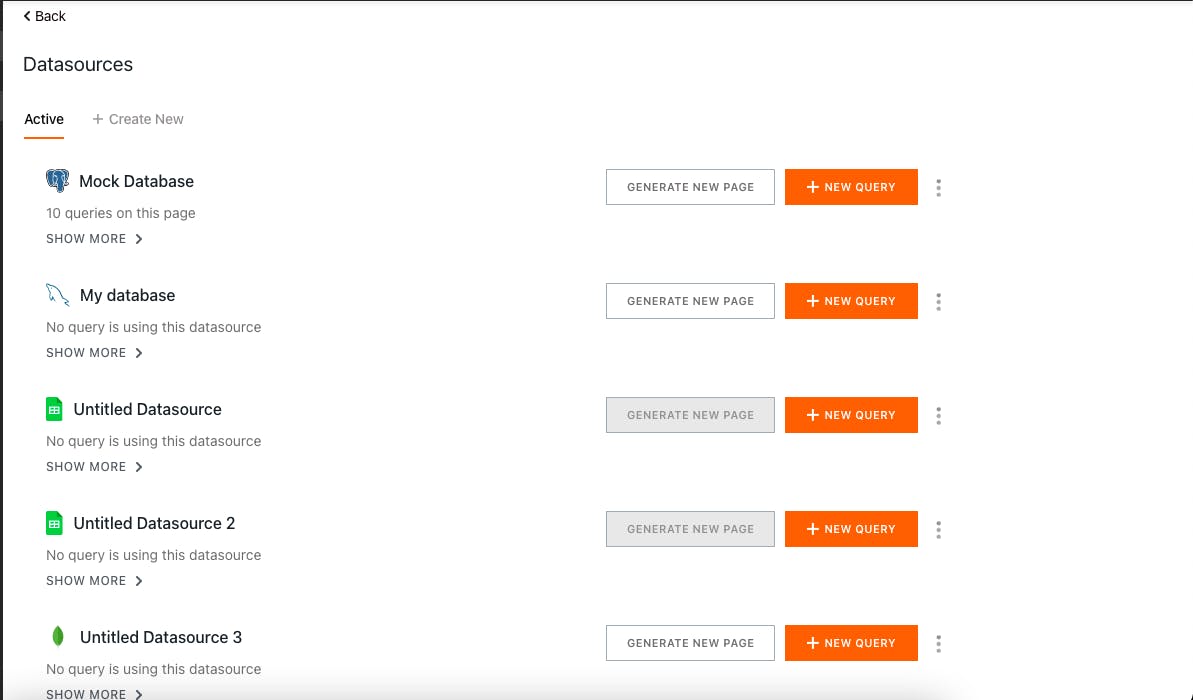
This allows you to perform CRUD operations against those tables. Let’s try to add our first widget. Now, click on the “+” button in front of Datasources. You should see the list of all connected data sources. Now click on “+ New Query” for the data source you want to run the query. Since we’re using a mock database so we’ll select that:
 Once you click the “+ New Query” button, you now need to click on the “Select” option from the list to run the SELECT queries:
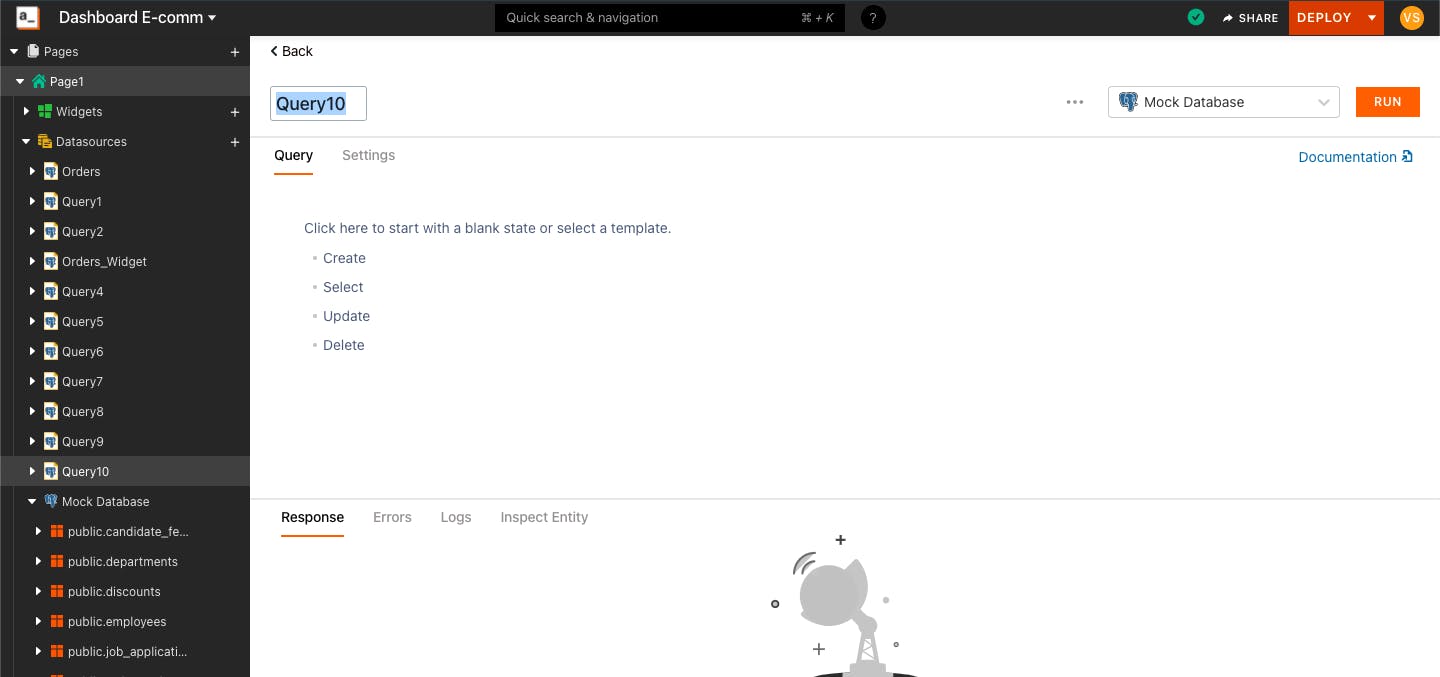
This will open a MySQL editor where you need to paste the below query:
SELECT count(public."users"."name"), date(public."users"."createdAt") FROM public."users"group by date(public."users"."createdAt") order by date(public."users"."createdAt") asc;
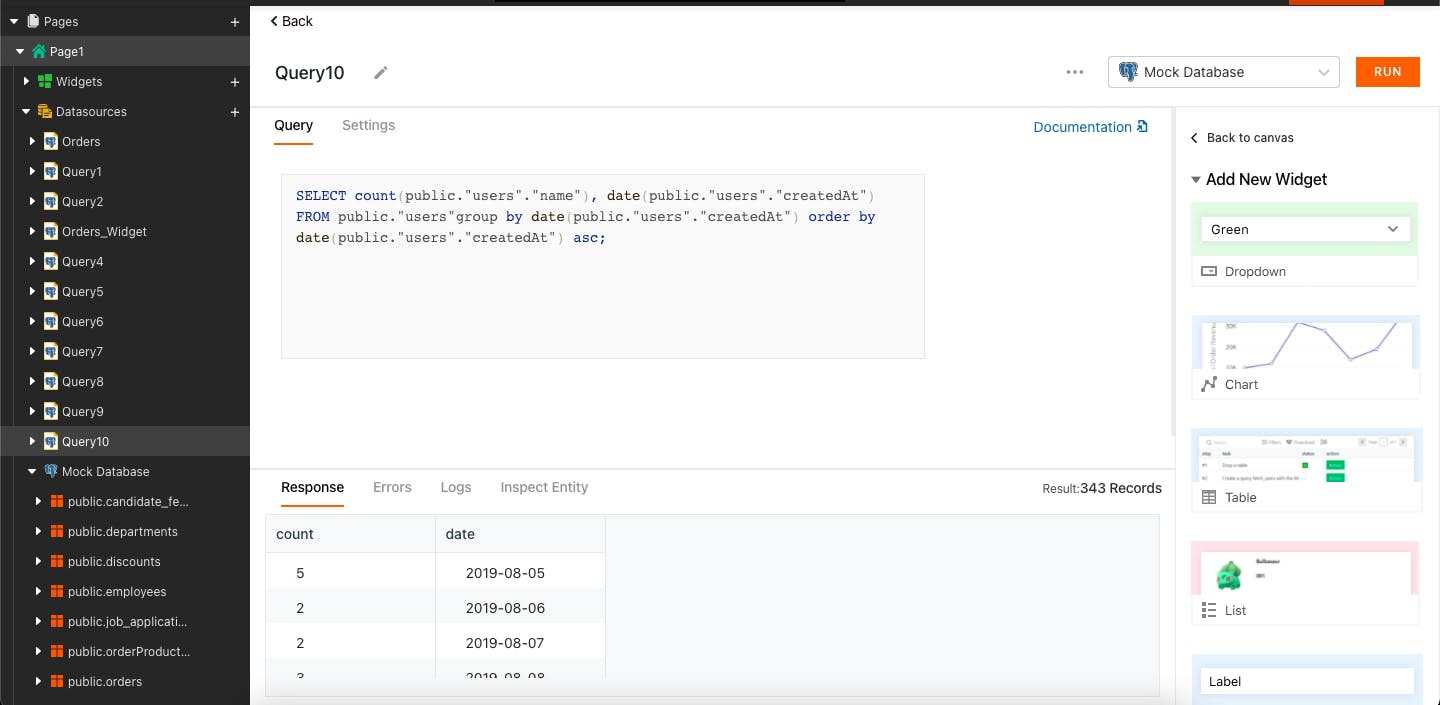
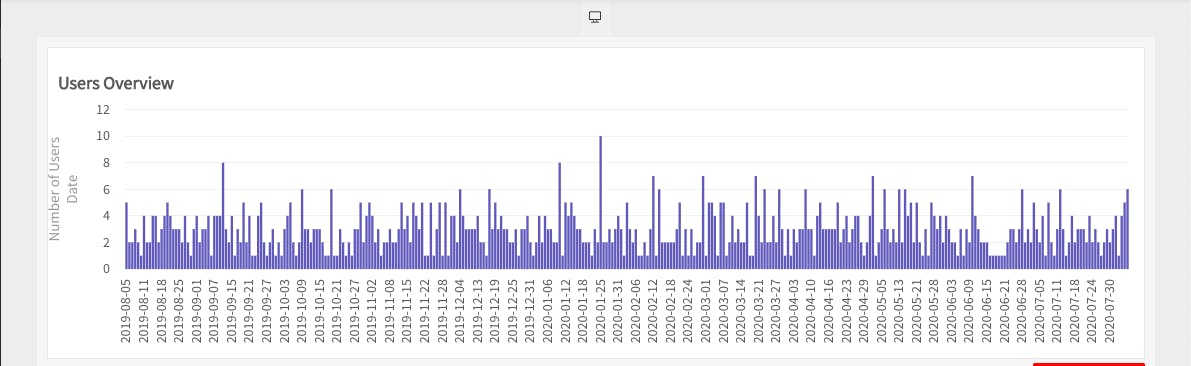
Now, to add the widget, we need to add it as a Chart. So, just select the chart widget, which is available at the right sidebar of the page.
Step -3: Add Stats for Orders
Hover the cursor on "public.orders" and click on the “Add” button and select the SELECT command option. Now, paste the below query:
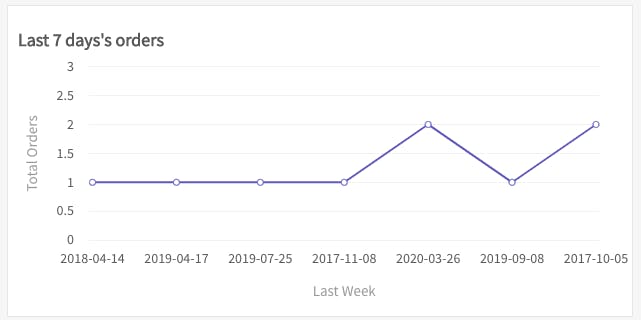
SELECT count(public."orders"."deliveryAddress"), public."orders"."orderDate" FROM public."orders" group by public."orders"."orderDate" LIMIT 7;
This will return the orders data for the last seven days. We now need to select the chart widget so that the data can be displayed.
Step -4: Add Stats for Revenue
Hover the cursor on “public.orders” and click on the “Add” button and select the SELECT command option. Now, paste the below query:
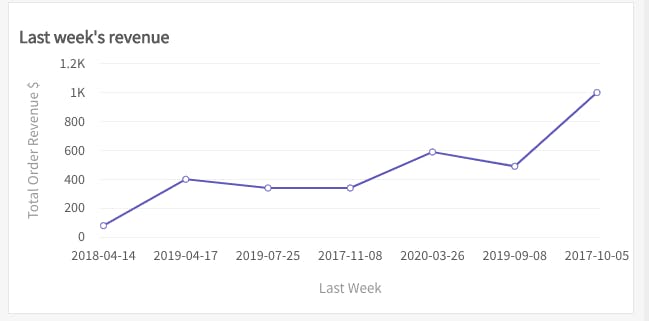
SELECT sum(public."orders"."orderAmount"), public."orders"."orderDate" FROM public."orders" group by public."orders"."orderDate" LIMIT 7;
This will return the revenue data for the last seven days. We now need to select the chart widget so that the data can be displayed.
Step -5: Adding employees’ data
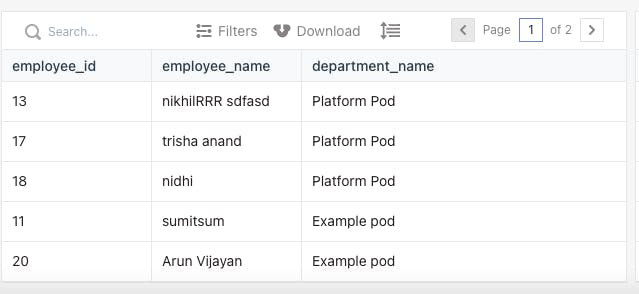
Hover the cursor on “public.employees,” and click on the “Add” button and select the “SELECT” command option. Now, paste the below query:
select public."employees"."employee_id", public."employees"."employee_name", public."departments"."department_name" from public."employees" LEFT JOIN public."departments" on public."departments"."department_id" = public."employees"."department_id";
This will return the employees’ data which includes employee id, employee name, and employee department. We now need to select the chart widget so that the data can be displayed.
Step -6: Add To-Do List for Employees
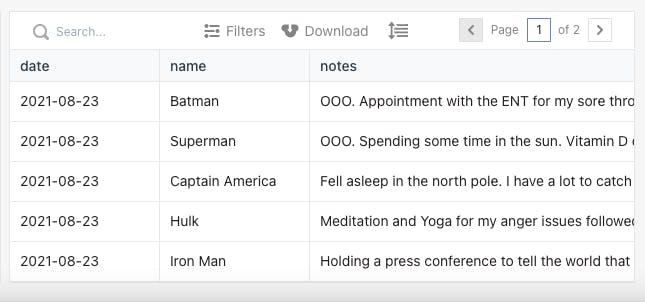
Hover the cursor on “public.standup” and click on the “Add” button and select the “SELECT” command option. Now, paste the below query:
SELECT public."standup_updates"."date",public."standup_updates"."name", public."standup_updates"."notes" FROM public."standup_updates" LIMIT 10;
This will return the employees’ standup data which includes the date, employee name, and employee notes. We now need to select the chart widget so that the data can be displayed.
Step -7: Deploying the dashboard
Once we’re done with adding and aligning all the widgets, we also need to deploy it; just click on the “Deploy” button at the top of the page including, and it’ll get deployed instantly!
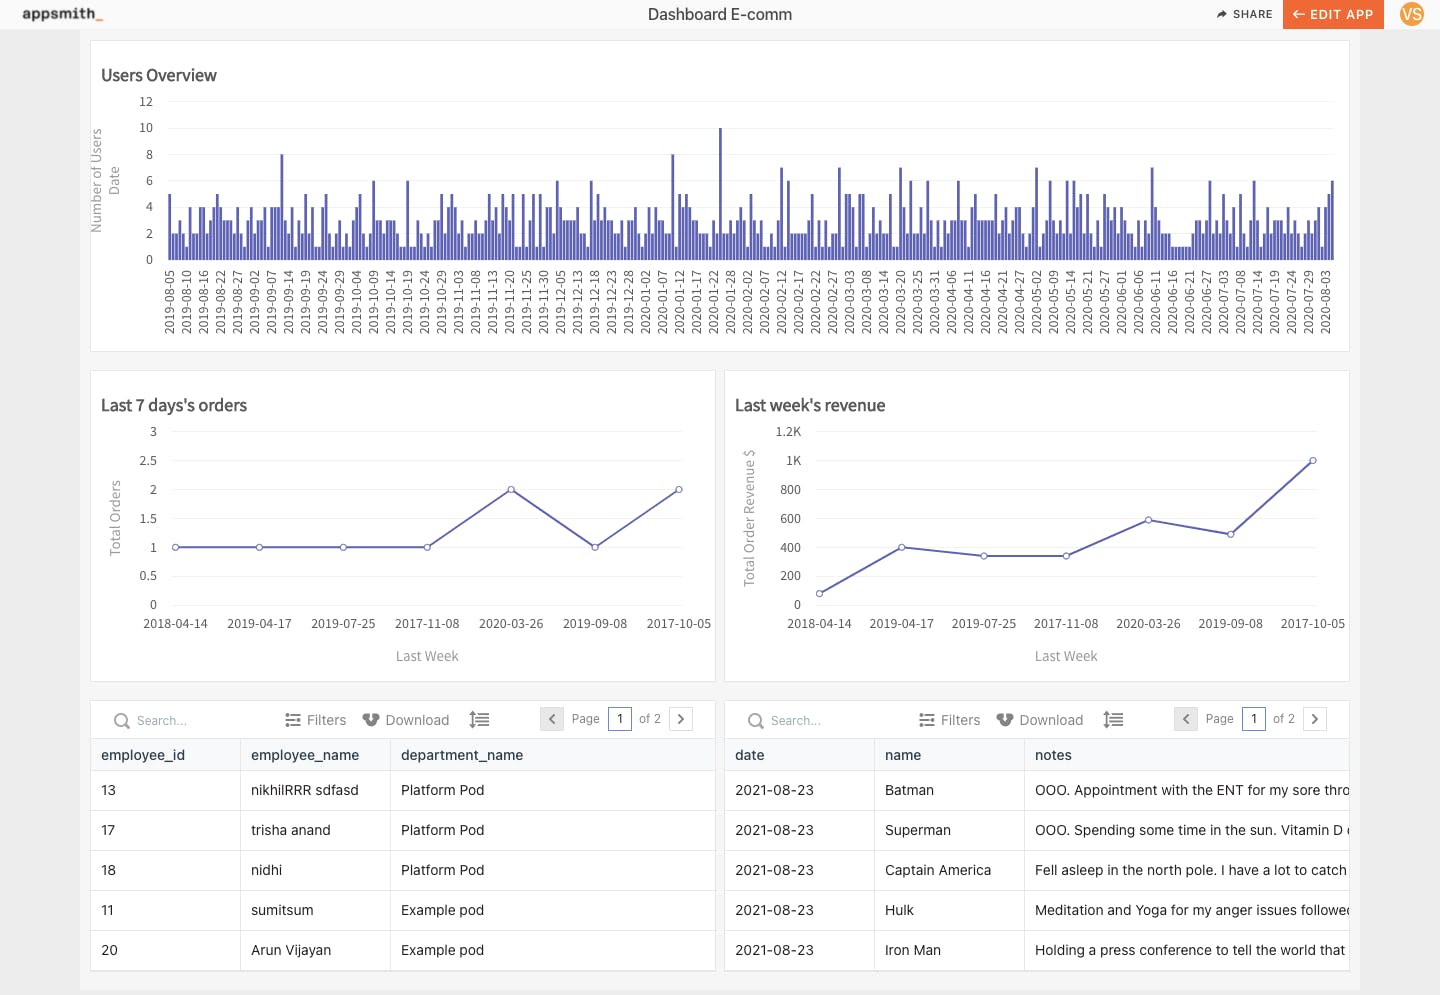
You can check out the live example here also.
Final Words
Displaying data from the database is very easy with Appsmith. Our plug-n-play UI allows you to add any database and display the data in graphs, charts, tables, dropdown or even as a normal text. You can even add a lot more functionalities in this dashboard like create new orders, create/update employee data, or even perform CRUD operations using our widgets to your database tables.