

Building a Mermaid.js Gantt Chart in a FileMaker Web Viewer

NO LONGER ON HASHNODE: Follow at: https://news.greenflux.us/
Nuclear Plant Operator (US Navy), Turned Freelancer, Turned Developer Advocate. Head of Developer Relations @ Appsmith, Inc Founder/ Freelancer @ GreenFlux, LLC
GREENFLUX, LLC WE'VE GOT YOUR APP COVERED. Veteran Owned & Operated Since 2016 - Tallahassee, FL
I’ve used a lot of low-code tools over the years, and one thing I’ve always enjoyed is pushing the limits of each platform and building things that aren’t supported out of the box. The first tool I really dove into was Claris FileMaker Pro. At the time (2010ish), I had no programming experience, so I really had no idea what to do with a web viewer in FileMaker (iframes in Appsmith), other than display a site from some external url. It didn’t seem all that useful to me.
Fast forward to today- I’ve spent the last few years pushing the limits of Appsmith, using iframes and custom widget with external libraries to create all sorts of new UI components and features. I now understand how powerful an iframe can be in a low-code tool. It’s an escape hatch for when you hit platform limits. It’s like punching a hole in the ceiling, making the sky the limit.
I’ve been out of FileMaker development for years, but recently I started thinking about all the cool stuff I could have done back then if I had known a little more about JavaScript and using libraries in an iframe. So I’ve decided to revisit my first ‘go-to’ platform, and rebuild some of the recent experiments I’ve been doing in Appsmith.
Today, I’ll be working with the Mermaid JS library to generate flow charts from records stored in FileMaker. This post was inspired by an Appsmith community template from Paul Chambless. Thanks Paul!
Mermaid.JS Intro
Mermaid JS is a powerful JavaScript library that allows developers to create complex diagrams and visualizations using simple text and code syntax. It’s a lot like markdown, but for charts instead of plain text.
For instance, just a few lines of text can be used to create a pie chart:
pie title NETFLIX
         "Time spent looking for movie" : 90
         "Time spent watching it" : 10
This works by placing the Mermaid code inside a div, and giving it the class of mermaid. The Mermaid library parses the doc and replaces all the mermaid divs with the rendered chart or graph, based on the text content of the div. Here's a full HTML doc, showing how to import the library.
<!DOCTYPE html>
<html>
<head>
<title>Mermaid Graph</title>
<script src="https://cdn.jsdelivr.net/npm/mermaid/dist/mermaid.min.js"></script>
<script>
mermaid.initialize({ startOnLoad: true });
</script>
</head>
<body>
<!-- Mermaid diagram container -->
<div class="mermaid">
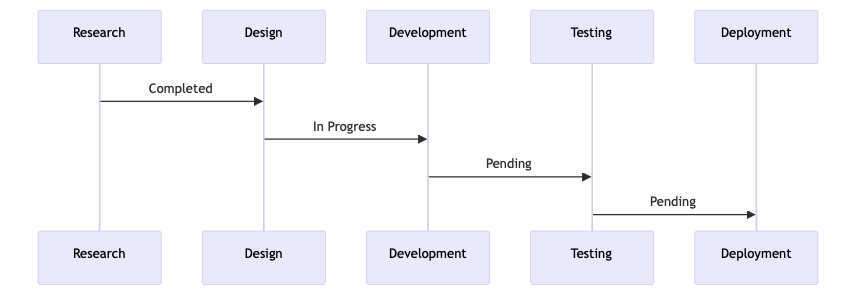
sequenceDiagram
participant Research
participant Design
participant Development
participant Testing
participant Deployment
Research->>Design: Completed
Design->>Development: In Progress
Development->>Testing: Pending
Testing->>Deployment: Pending
</div>
</body>
</html>
…which renders as
Using Mermaid in FileMaker
Create a template for the web viewer
First, create a template for the web viewer and insert a MERMAID_CODE placeholder for where the Mermaid code would go.
<!DOCTYPE html>
<html>
<head>
    <title>Mermaid Graph</title>
    <script src="https://cdn.jsdelivr.net/npm/mermaid/dist/mermaid.min.js"></script>
    <script>
        mermaid.initialize({ startOnLoad: true });
    </script>
</head>
<body>
<!-- Mermaid diagram container -->
<div class="mermaid">
MERMAID_CODE
</div>
</body>
</html>
Then save this to a field in a new table. For mine, I used webviewer::html.
Set up web viewer
Next, add a code field to the same table, and add it to a layout, along with a web viewer.
Set the web viewer contents to:
Substitute ( html ; “MERMAID_CODE” ; code )
Load in a Mermaid Example
Now just paste any example from the Mermaid docs into the code field, and you should have a working chart or graph. This is hard-coded though. We want to insert data from FileMaker! That’s going to require some calculations and/or scripting. But before we shift gears, there’s one more thing we can do while we’re here.
You may want to add some custom styling, or even use other JavaScript libraries in the same web viewer. To make this easier, I suggest adding two more fields for css and javascript. Then update the template and the web viewer accordingly.
<!DOCTYPE html>
<html>
<head>
    <title>Mermaid Graph</title>
    <script src="https://cdn.jsdelivr.net/npm/mermaid/dist/mermaid.min.js"></script>
    <script>
        mermaid.initialize({ startOnLoad: true });
    </script>

<style>CSS_CODE</style>
<script>JS_CODE</script>

</head>
<body>
<!-- Mermaid diagram container -->
<div class="mermaid">
MERMAID_CODE
</div>
</body>
</html>
And this for the calculation in the web viewer:
Substitute ( html ;

  ["JS_CODE" ; js ];

  ["CSS_CODE" ; css ] ;

  ["MERMAID_CODE" ; mermaid ]

)
You may also want to add a Tab Control with Panels to edit each field.
Generating Text for Mermaid Charts
Ok, now that the basics are working, on to the fun part! Generating Mermaid charts dynamically from FileMaker data.
I have a Tasks table with the following data:

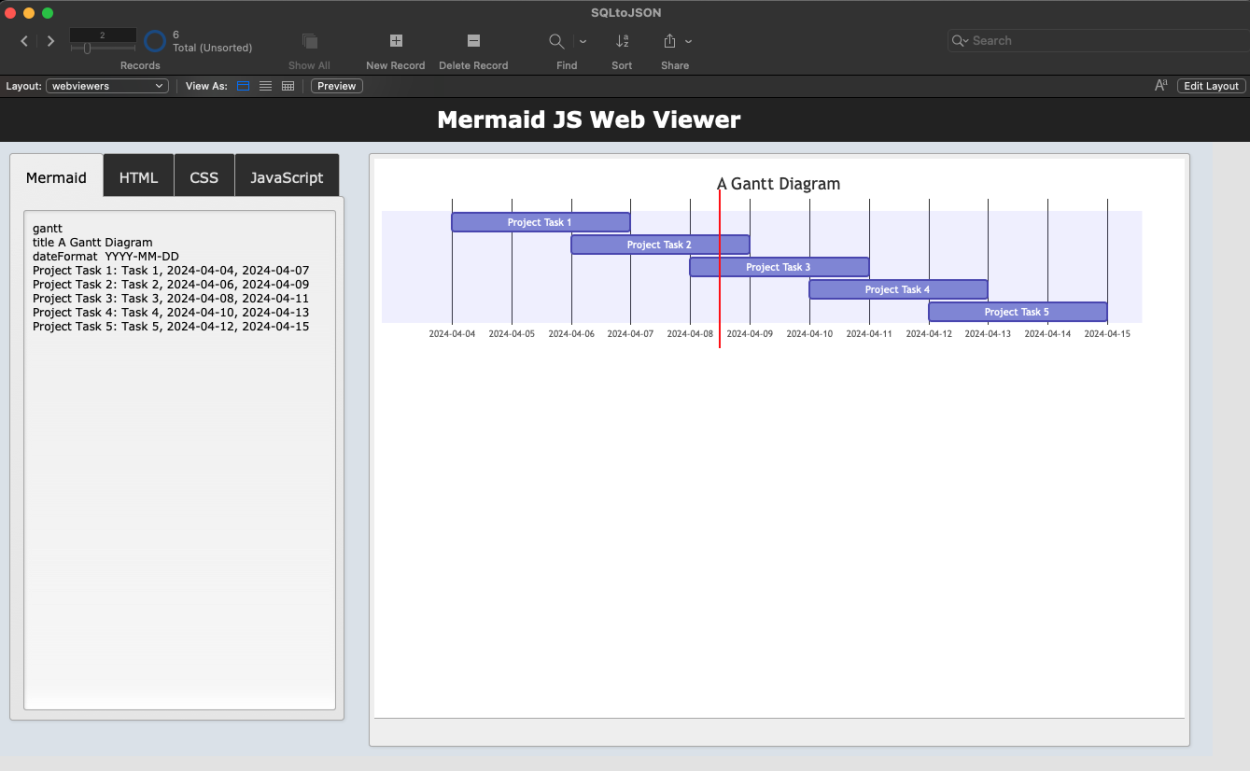
And I need to turn it into this format for a Gantt chart:
gantt
title A Gantt Diagram
dateFormat  YYYY-MM-DD
Project Task 1: Task 1, 2024-04-04, 2024-04-07
Project Task 2: Task 2, 2024-04-06, 2024-04-09
Project Task 3: Task 3, 2024-04-08, 2024-04-11
Project Task 4: Task 4, 2024-04-10, 2024-04-13
Project Task 5: Task 5, 2024-04-12, 2024-04-15
Years ago I would have approached this with a script, but now we have the WHILE function in FileMaker. No looping scripts needed!
First, I used ExecuteSQL to get the data as comma separated values. But one of my column names is an SQL reserved word, so I had to use escape quotes. Then I used SUBSTITUTE to break each row into a new list item to iterate through. From there, a used a WHILE loop to build each task entry, then return the final list, along with the extra header info needed for this chart type.
Let([
    ganttHeader = "gantt" & ¶ &
    "title A Gantt Diagram"  & ¶ &
    "dateFormat  YYYY-MM-DD";

    data = ExecuteSQL("SELECT name, start, \"end\", id FROM Tasks"; ""; "¶");
    rows = Substitute(data; "¶"; ¶);
    maxIndex = ValueCount(rows)
];
    ganttHeader & ¶ &
    While([
        index = 1;
        ganttBody = ""
    ];
        index <= maxIndex;
        [
            row = GetValue(rows; index);
            fields = Substitute(row; ","; ¶);
            taskName = GetValue(fields; 1);
            startDate = GetValue(fields; 2);
            endDate = GetValue(fields; 3);
            id = GetValue(fields; 4);

            // Construct the Gantt chart entry for this task
            ganttEntry = taskName & ": " & id & ", " & startDate & ", " & endDate;

            // Append this task's entry to the ganttBody
            ganttBody = ganttBody & ganttEntry & ¶;
            index = index + 1
        ];
Substitute(ganttBody; "¶"; ¶)    )
)
Using this in a calculation field with the ‘do not store result’ option will enable realtime charts based on your data!
Conclusion
This was a fun, first-try at using a web viewer in FileMaker for something besides displaying an external website. There are a ton of other use cases and JavaScript libraries that could be used to extend FileMaker Pro, Appsmith, or any other low-code platform that supports iframes or custom widgets.
I hope this helps other get started with 'punching holes in the ceiling' of platform limitations! Got an idea for a new integration? Drop a comment below.


